Successfully added
...see more
Application Insights is an extensible Application Performance Management (APM) service for developers and DevOps professionals. Use it to monitor your live applications. It will automatically detect performance anomalies, and includes powerful analytics tools to help you diagnose issues and to understand what users actually do with your app. It's designed to help you continuously improve performance and usability. It works for apps on a wide variety of platforms including .NET, Node.js and Java EE, hosted on-premises, hybrid, or any public cloud.
...see more
Below I list some services provided by Application Insights:
- HTTP request rates, response times, and success rates
- Dependency (HTTP & SQL) call rates, response times, and success rates
- Exception traces from both server and client
- Diagnostic log traces
- Page view counts, user and session counts, browser load times, and exceptions
- AJAX call rates, response times, and success rates
- Server performance counters
- Custom client and server telemetry
- Segmentation by client location, browser version, OS version, server instance, custom dimensions, and more
- Availability tests
Along with the preceding, there are associated diagnostic and analytics tools available for alerting and monitoring with various different customizable metrics. Application Insights is an excellent tool for any cloud service with its own query language and customizable dashboards.
...see more
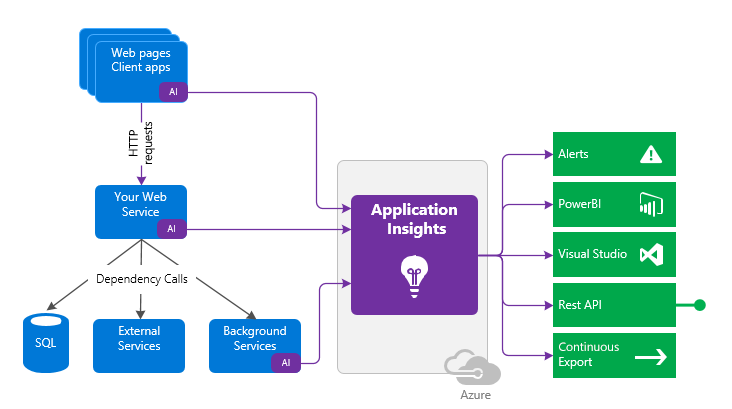
To use Application Insights, you either install a small instrumentation package (SDK) in your app, or enable Application Insights by using the Application Insights agent. For languages and platforms that support the Application Insights agent, see Supported languages.
You can instrument the web app, any background components, and the JavaScript in the web pages themselves. The app and its components don't have to be hosted in Azure.
...see more
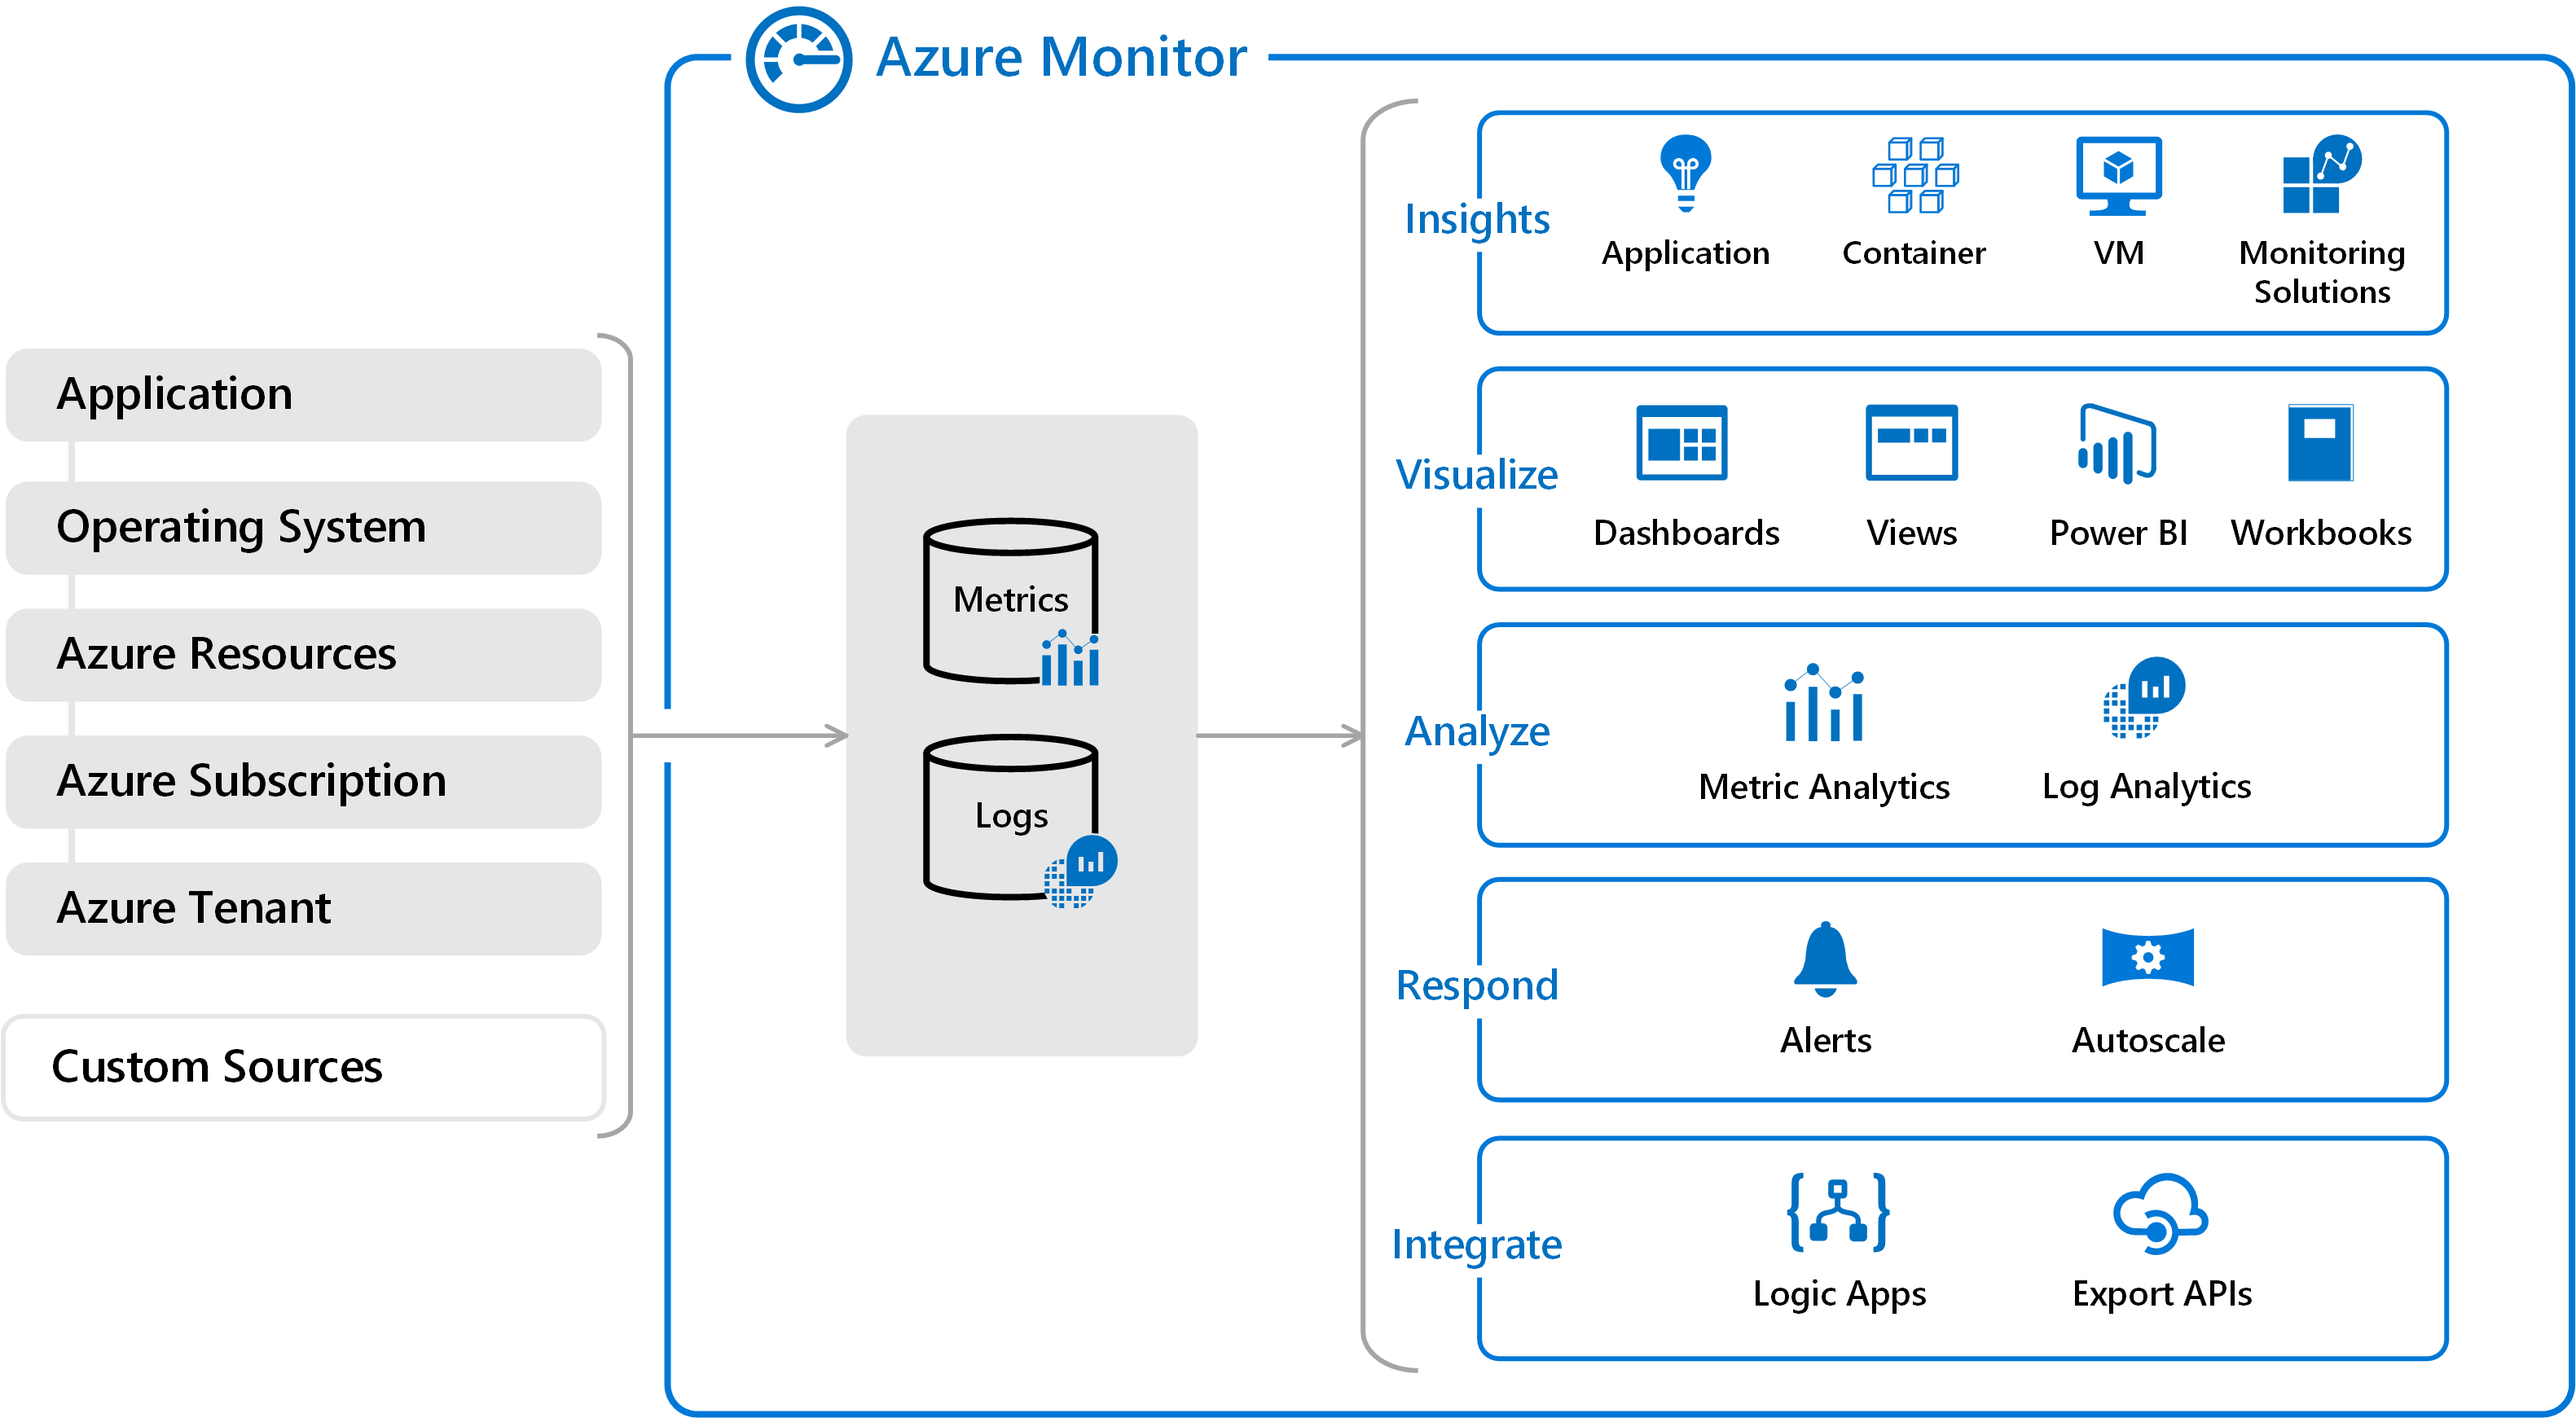
The following diagram gives a high-level view of Azure Monitor. At the center of the diagram are the data stores for metrics and logs, which are the two fundamental types of data used by Azure Monitor. On the left are the sources of monitoring data that populate these data stores. On the right are the different functions that Azure Monitor performs with this collected data. This includes such actions as analysis, alerting, and streaming to external systems.
...see more
Tracking custom events with TrackEvent() in Azure Application Insights helps you monitor how users interact with your app. However, to obtain meaningful data, it's essential to name your events clearly and consistently.
Here are some best practices:
Use Clear, Descriptive Names
Write event names using a Verb-Noun format like UserLoggedIn, FileDownloaded, or OrderSubmitted. This makes them easy to understand.
Stick to PascalCase
Use PascalCase (each word starts with a capital letter), and avoid:
- Spaces (
User Logged In) - Dashes (
User-Logged-In) - Underscores (
user_logged_in)
Use: UserLoggedIn
Don’t Include Dynamic Data
Keep user IDs, file names, or other changing values out of the event name.
Instead, put that info in custom properties or metrics.
Keep It Consistent
Follow the same naming style across your app. This makes it easier to search and analyze data later.
Be Specific When Needed
If similar actions happen in different contexts, make your event name more specific:ContactFormSubmitted vs. FeedbackFormSubmitted
Tip
Use a naming template like:<Action><Entity>[<Qualifier>]
Example: AddedItemToCart
A clean, consistent naming strategy makes your telemetry easier to work with, both now and in the future.
Referenced in:
Comments