Snipps
GitHub Copilot becomes much more effective when it is customized for your project. Rather than relying on one-off prompts, you can combine several reusable building blocks that provide context, standardize outputs, automate repetitive work, and create focused AI interactions.
A well-organized customization strategy typically includes the building blocks:
- Instructions: Define project-wide coding standards, architecture, documentation, and development guidelines.
- Custom Instructions: Add folder- or task-specific rules that extend the general instructions for a particular part of the repository.
- Templates: Provide reusable file structures with placeholders for creating consistent documents and source files.
- Prompts: Automate repetitive, multi-step workflows such as creating new features, documentation, or assignments.
- Chat Modes: Create specialized AI conversations for brainstorming, planning, reviews, or other focused tasks.
How They Work Together
A typical workflow might look like this:
- Instructions provide the overall project context.
- Custom Instructions add rules for a specific area of the repository.
- Templates define the structure of the files to generate.
- Prompts execute the workflow and create or update the required files.
- Chat Modes support focused discussions before or during implementation.
Using these building blocks together makes Copilot more predictable, produces more consistent results, and reduces the need to repeatedly explain your project's standards and workflows.
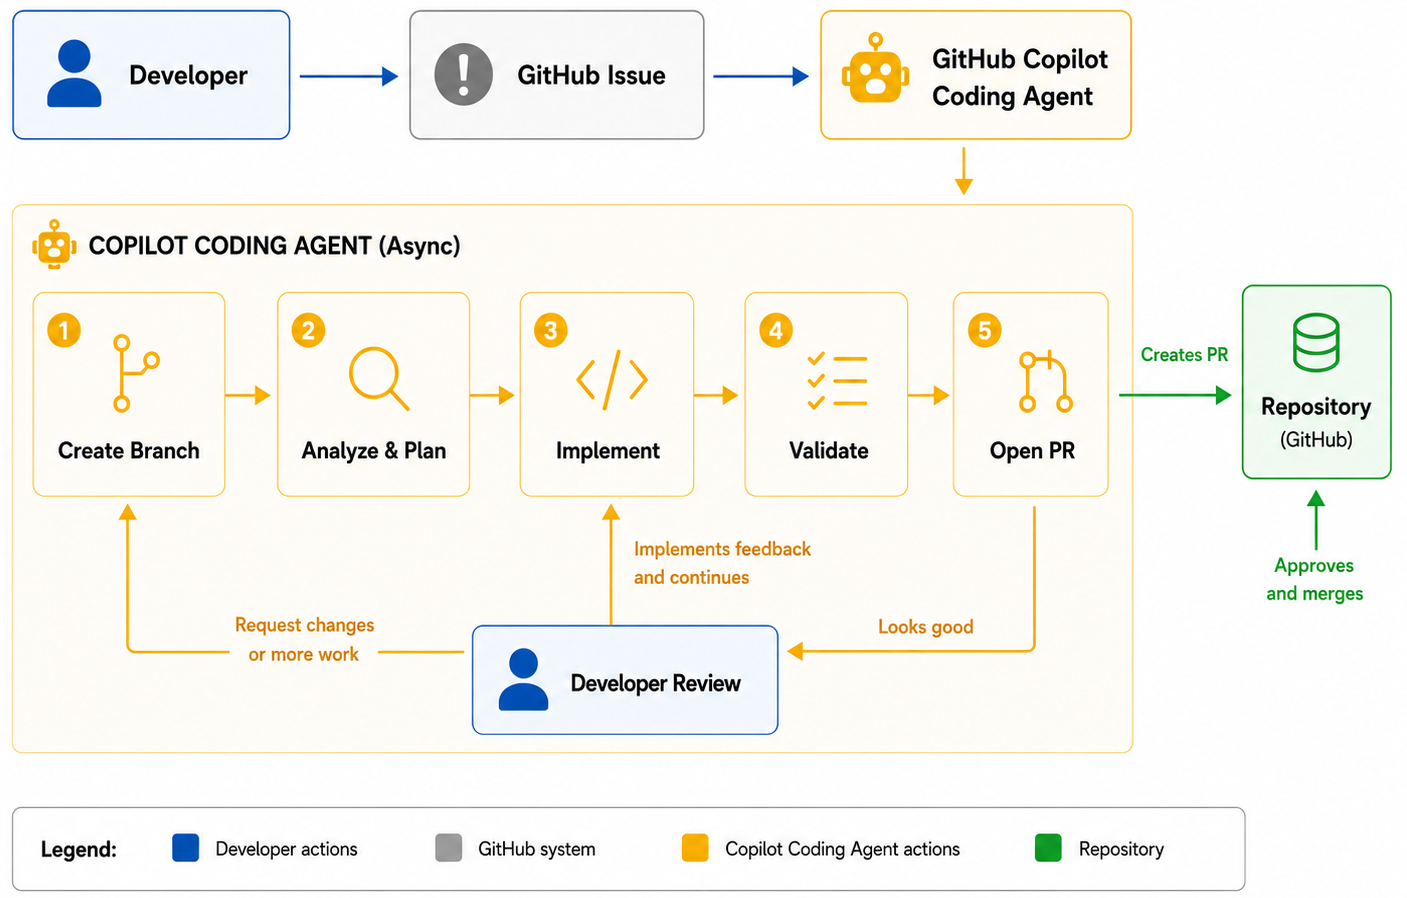
Instead of helping you one prompt at a time, GitHub Copilot Coding Agent works like an autonomous developer. You assign it a GitHub issue, and it independently implements the requested changes while you continue working on other tasks.
How does it work?
- Assign a GitHub issue to Copilot.
- The Coding Agent creates its own branch and starts a secure GitHub Actions environment.
- It analyzes the repository, writes the required code, runs tests and validation, and commits its progress.
- When finished, it opens a draft pull request containing the proposed solution, implementation details, and a summary of the changes.
- You review the code, provide feedback if needed, and decide whether to merge the pull request.
What can it do?
The Coding Agent is well suited for:
- Implementing new features
- Fixing bugs
- Refactoring existing code
- Adding or updating tests
- Improving documentation
- Performing routine maintenance tasks
Why use it?
Unlike Agent Mode, which works interactively inside your IDE, the Coding Agent runs asynchronously on GitHub. It can continue working in the background while you focus on other development tasks. Because every change is delivered through a standard pull request, your existing review process, branch protections, and approval workflow remain unchanged. When combined with Model Context Protocol (MCP), the Coding Agent can also use project-specific tools and external data sources to produce more accurate, context-aware solutions.
GitHub Copilot can do more than answer general questions. With custom chat modes, you can create specialized AI experiences that guide conversations toward a specific goal. Rather than relying on a generic assistant, a chat mode defines how Copilot should respond, what tools it may use, and which rules it should follow. This makes conversations more consistent and helps the AI stay focused on the task at hand.
Chat modes are ideal for activities such as brainstorming new features, reviewing architecture, planning documentation, or coaching developers. Instead of repeatedly explaining how you want Copilot to behave, you define the behavior once and reuse it whenever needed.
How to create a custom chat mode
- Create a
.github/chatmodesdirectory if it does not already exist. - Add a new file ending with
.chatmode.md. - Define the chat mode's metadata, including its description and available tools.
- Describe the response structure you expect Copilot to follow.
- Add clear rules that limit the scope and style of the conversation.
- Save the file and select the chat mode from the Copilot Chat interface.
Example
---
description: Brainstorm ideas for new learning assignments
tools:
  - codebase
---

# Response Format

For every response:

1. Summarize the current project or codebase.
2. Suggest 3–5 new ideas.
3. Explain why each idea is valuable.
4. End with one follow-up question.

# Rules

- Keep responses concise.
- Focus on ideas, not implementation details.
- Build on existing project content.
- Always finish with a question.
Once the chat mode is available, every conversation follows the same structure and objectives. This produces more predictable responses and reduces the need to rewrite prompts for recurring activities.
Best practices
- Create one chat mode for each recurring role or workflow.
- Define a clear response format with consistent sections.
- Limit the scope so Copilot stays focused.
- Keep rules short and unambiguous.
- Combine chat modes with instruction files, templates, and reusable prompts for an even more consistent AI-assisted workflow.
Templates are a simple way to standardize files that are created repeatedly. Instead of asking GitHub Copilot to generate content from scratch each time, you provide a predefined file containing the desired structure, headings, placeholders, and optional example content. Copilot can then use this template as the starting point, ensuring that every generated file follows the same layout and includes all required sections.
Templates are especially useful for documentation, assignments, design documents, issue reports, meeting notes, tutorials, and many other project artifacts. By combining templates with reusable prompts and instruction files, you can automate repetitive workflows while maintaining consistent quality across your repository.
How to create a template
- Create a folder to store reusable templates (for example,
templates). - Create a Markdown file that contains the standard structure.
- Replace project-specific content with placeholders.
- Reference the template from a reusable prompt so Copilot knows when to use it.
- Update the template whenever your standard format changes.
Example
# assignment-template.md

# {{Assignment Title}}

## Learning Objectives

- Objective 1
- Objective 2

## Prerequisites

- Requirement 1

## Instructions

1. Step one
2. Step two

## Starter Code

```python
# Add your solution here
Summary
Briefly describe what the learner should have accomplished.
A reusable prompt can then instruct Copilot to copy this template, replace the placeholders with the user's input, generate any optional starter code, and update related project files automatically.
Best practices
- Keep templates focused on structure rather than detailed content.
- Use clear placeholders that are easy to identify and replace.
- Create separate templates for different document types.
- Review templates regularly to keep them aligned with current project standards.
- Let prompts perform the customization while templates provide the consistent foundation.
Many AI coding assistants only know what is included in your prompt or current file. Model Context Protocol (MCP) extends GitHub Copilot by giving it secure access to external tools and project-specific information, making its responses far more relevant and accurate.
What is MCP?
MCP is an open standard that connects AI assistants with repositories, documentation, APIs, databases, issue trackers, CI/CD systems, and other development tools. Instead of manually copying information into a prompt, Copilot can retrieve the context it needs automatically.
How does it work?
- An MCP server exposes tools and data through a standard interface.
- GitHub Copilot discovers these tools and can call them when needed.
- The retrieved information is added to the AI's context before generating a response.
- Developers remain in control and can review or approve actions before they are executed.
What can Copilot do with MCP?
With the appropriate MCP servers, Copilot can:
- Read GitHub issues and pull requests
- Search documentation and codebases
- Query external APIs or internal knowledge bases
- Access CI/CD logs and monitoring data
- Integrate with tools such as Slack, Figma, or custom business systems
By combining MCP with Agent Mode or the Coding Agent, GitHub Copilot becomes a context-aware development partner that can understand your project, use external tools, and automate complex development workflows while keeping developers in control.
Many development activities involve repeating the same sequence of actions. Prompt files allow you to package those steps into reusable workflows that can be launched directly from Copilot Chat.
Instead of writing a long prompt every time, you simply execute the reusable prompt and let Copilot perform the workflow.
What prompt files can do
A reusable prompt can:
- Ask for missing information
- Create folders
- Generate multiple files
- Apply templates
- Update configuration files
- Reference instruction files
How to create a reusable prompt
- Create a
.github/promptsfolder. - Create a file ending with
.prompt.md. - Describe the workflow as numbered steps.
- Reference templates or instruction files when appropriate.
- Save the file.
Example
# .github/prompts/new-assignment.prompt.md

Create a new assignment.

1. Ask for the assignment topic if none is provided.
2. Create a new folder in `/assignments`.
3. Generate `assignment.md`.
4. Add starter code if required.
5. Update `config.json`.
6. Verify that all generated files are linked correctly.
You can then invoke it from Copilot Chat using:
/new-assignmentIf the required information is missing, Copilot asks follow-up questions before completing the remaining steps.
Best practices
- Design prompts around complete workflows.
- Break complex tasks into numbered steps.
- Reference instruction files instead of repeating guidance.
- Keep prompts reusable rather than project-specific.
- Test prompts regularly as your project evolves.
Different folders often require different types of guidance. Documentation, tests, templates, and source code rarely follow identical rules. Custom instruction files allow you to define folder-specific behavior so Copilot adapts automatically depending on where you are working.
When to use custom instructions
Examples include:
- Documentation folders
- Assignment content
- Test projects
- Infrastructure scripts
- Sample applications
How to create custom instructions
- Create an instruction file in the appropriate location.
- Describe the expected structure and formatting.
- Specify any required sections.
- Define optional content such as starter code or examples.
Example
# assignments.instructions.md

When creating a new assignment:

- Start with a title.
- Add learning objectives.
- Include prerequisites.
- Add step-by-step instructions.
- Finish with review questions.
- Provide starter code when applicable.
Whenever Copilot generates content for assignments, it can follow these requirements automatically.
Best practices
- Keep each instruction focused on one purpose.
- Store instructions close to the content they describe.
- Update them whenever the folder structure changes.
- Avoid duplicating global project rules.
GitHub Copilot has evolved from an AI code completion tool into a comprehensive development assistant. Today it supports the entire software development lifecycle, helping developers write code, review changes, automate tasks, and rapidly prototype new ideas.
Writing Code
- Code Completion (2021) – Provides inline AI code suggestions while you type. Best for: Faster coding and reducing repetitive work.
- Copilot Chat (2023) – Answers coding questions, explains code, generates tests, and assists with debugging. Best for: Learning and problem solving.
- Copilot Edits (2024) – Applies coordinated changes across multiple files from a single prompt. Best for: Refactoring and implementing features.
Code Quality
- Code Review (2024) – Detects bugs, performance issues, and improvement opportunities. Best for: Improving code before human review.
- Pull Request Summaries (2024) – Automatically creates clear summaries of code changes. Best for: Better collaboration and documentation.
AI Agents
- Agent Mode (2025) – Plans, edits, tests, and iterates directly within your IDE. Best for: Interactive, multi-step development tasks.
- Coding Agent (2025) – Works asynchronously on GitHub by completing issues and opening pull requests. Best for: Automating routine development work.
Advanced AI
- Multi-Model Support (2024) – Lets you switch between different AI models to suit each task.
- Model Context Protocol (MCP) (2024) – Connects Copilot to repositories, documentation, APIs, and external tools, enabling richer context and more accurate AI assistance.
- GitHub Spark (2025) – Generates interactive application prototypes from natural-language prompts. Best for: Quickly validating ideas and creating proof-of-concepts.
Together, these capabilities transform GitHub Copilot from a coding assistant into an AI-powered development platform that helps developers build software faster, with greater confidence and less repetitive work.
AI-generated code is most valuable when it follows your project's conventions. Instead of repeating coding rules in every prompt, you can store them in an instruction file. GitHub Copilot automatically uses these instructions when generating code, helping produce more consistent results across the repository.
What instruction files are
Instruction files define general project guidance, such as:
- Coding style
- Naming conventions
- Architecture preferences
- Testing requirements
- Documentation standards
Unlike prompts, instruction files do not perform actions. They simply provide persistent context for Copilot.
How to create an instruction file
- Create a
.github/instructionsfolder if it does not already exist. - Create a Markdown instruction file.
- Add the development rules you want Copilot to follow.
- Commit the file with your repository so the whole team benefits.
Example
# .github/instructions/coding.instructions.md

## Coding Standards

- Use C# 13 features where appropriate.
- Prefer dependency injection.
- Write XML documentation for public APIs.
- Use async/await for I/O operations.
- Add unit tests for new functionality.
Once saved, Copilot can use these guidelines whenever it generates code for your project.
Best practices
- Keep instructions concise.
- Separate unrelated topics into multiple files.
- Review them as your project evolves.
- Avoid conflicting rules.
There is no universal platform that fits every AI project. The best solution depends on your technical capabilities, business goals, existing systems, budget, and long-term strategy. In many cases, organizations combine multiple approaches—for example, using cloud services together with open-source frameworks or integrating AI into existing enterprise platforms.
Before selecting a technology, it is worth evaluating not only today's requirements but also how the solution will evolve over time.
Questions to ask
- What business problem should the AI agent solve?
- How much customization is required?
- What technical expertise does the team have?
- Which systems need to be integrated?
- What security and compliance requirements exist?
- How important are speed and long-term maintenance?
Quick comparison
| If your priority is... | Consider... |
|---|---|
| Maximum flexibility | Custom development |
| Fast deployment | Low-code platforms |
| Existing business systems | Enterprise platforms |
| Scalability and managed services | Cloud platforms |
| Advanced customization | Open-source frameworks |
A practical recommendation
Many successful AI solutions combine multiple technologies. For example:
- Use Azure OpenAI, AWS Bedrock, or Vertex AI to access AI models.
- Build business logic with LangGraph, Semantic Kernel, or AutoGen.
- Connect workflows using Power Automate, n8n, or Zapier.
- Integrate with existing enterprise platforms such as Salesforce, SAP, or ServiceNow when business data and workflows already exist.
This layered approach lets you benefit from the strengths of each technology instead of relying on a single platform.
Summary
Choose the platform that best fits your business goals, available skills, and existing technology landscape. The most successful AI projects focus on solving business problems—not on using a particular tool.
GitHub Copilot has evolved from an AI code completion tool into a powerful development assistant. With the introduction of AI development agents, Copilot can now help automate entire development workflows rather than simply suggesting individual lines of code.
Instead of acting as an autocomplete tool, AI agents understand high-level objectives, plan the required steps, modify multiple files, execute tests, review results, and assist with completing development tasks. Developers remain in control, reviewing and approving changes while Copilot handles much of the repetitive implementation work.
What GitHub Copilot Can Do
Modern GitHub Copilot agents can assist with tasks such as:
- Implementing new features
- Fixing bugs and refactoring code
- Writing and improving tests
- Generating or updating documentation
- Reviewing code and suggesting improvements
- Creating commits and pull requests
- Building application prototypes from natural language
Depending on the workflow, these tasks can be performed directly inside the IDE or autonomously in GitHub repositories.
Better Results Through Context
GitHub Copilot becomes significantly more effective when it understands your project. By using repository context, documentation, coding standards, issues, pull requests, and external tools, it can generate more accurate and relevant solutions that fit your existing codebase.
Best Practices
To get the best results, provide clear objectives, supply sufficient context, and always review generated changes before accepting them. Think of GitHub Copilot as a collaborative teammate that accelerates development while leaving architecture, security, and business decisions to the developer.
AI development agents represent the next step in GitHub Copilot's evolution, enabling developers to spend less time on repetitive coding and more time designing, solving problems, and delivering high-quality software.
Open-source frameworks give developers the freedom to build AI agents without being tied to a commercial platform. They provide reusable components for common AI patterns such as agent orchestration, memory, tool calling, and workflow management, while still allowing full control over the implementation.
These frameworks evolve quickly and are often among the first to support new AI capabilities. They are a popular choice for development teams that want maximum flexibility and are comfortable managing their own infrastructure and deployments.
Popular frameworks
- LangGraph
- LangChain
- AutoGen
- CrewAI
- Semantic Kernel
- LlamaIndex
Key advantages
- Highly customizable
- No vendor lock-in
- Large developer communities
- Supports advanced agent architectures
- Easy to combine with custom code
Things to consider
- Requires software development expertise
- Community support instead of guaranteed enterprise support
- Frequent updates may introduce breaking changes
- Security and maintenance remain your responsibility
Ideal use cases
- Multi-agent systems
- Research and experimentation
- Custom AI applications
- Enterprise solutions requiring maximum flexibility
- Teams building reusable AI platforms
Summary
Open-source frameworks provide an excellent balance between flexibility and productivity. They accelerate AI development while allowing developers to keep full control over architecture and implementation.
Cloud providers offer complete ecosystems for building, deploying, and managing AI agents. Instead of assembling individual components yourself, these platforms combine AI models with infrastructure, security, storage, monitoring, and development tools. This allows development teams to focus on building intelligent solutions rather than managing servers and infrastructure.
Cloud platforms are particularly attractive for organizations that already run their applications in the cloud, as they integrate naturally with existing services and can scale from small prototypes to enterprise-wide deployments.
Leading cloud platforms
- Microsoft Azure OpenAI, Azure AI Foundry, Azure AI Search, Azure Functions, Azure Logic Apps
- AWS Bedrock, Amazon SageMaker
- Google Vertex AI, Google AI Studio
Key advantages
- Enterprise-grade security
- Automatic scalability
- Managed AI services
- Built-in monitoring and reliability
- Easy integration with cloud resources
Things to consider
- Ongoing cloud costs
- Learning platform-specific services
- Possible dependency on a single cloud provider
Ideal use cases
- Enterprise AI applications
- Customer-facing AI services
- Large-scale automation
- AI solutions that require high availability
- Organizations already using cloud infrastructure
Summary
Cloud platforms provide a powerful foundation for AI agents by combining managed AI services with secure and scalable infrastructure. They reduce operational effort while making it easier to build production-ready AI solutions.
Not every AI solution requires a team of developers. Low-code and no-code platforms allow users to build AI-powered workflows through visual interfaces instead of writing large amounts of code. By connecting triggers, actions, and AI models, organizations can automate everyday tasks in a fraction of the time needed for traditional development.
These platforms are especially useful for creating internal automations, prototypes, or business processes that integrate multiple applications. While they may not offer the same flexibility as custom development, they provide an excellent balance between speed and functionality.
Popular platforms
- Zapier Agents
- n8n
- Microsoft Power Automate
- Microsoft Power Platform
- Make (formerly Integromat)
Key advantages
- Little or no programming required
- Fast development and deployment
- Hundreds of built-in integrations
- Easy workflow automation
- Suitable for rapid prototyping
Things to consider
- Limited customization for complex scenarios
- Advanced workflows can become difficult to maintain
- Platform capabilities differ
Ideal use cases
- Business process automation
- Connecting multiple applications
- AI assistants for internal teams
- Personal productivity workflows
- Proof-of-concept projects
Summary
Low-code platforms make AI accessible to a much wider audience. They are an excellent choice when speed, simplicity, and integration are more important than complete technical control.
Many organizations already use business platforms that now include built-in AI capabilities. Rather than creating an AI agent from scratch, these platforms allow you to build intelligent assistants directly within existing business applications. This significantly reduces development effort because the agent can immediately access business data, workflows, permissions, and automation features that already exist.
For companies that are heavily invested in a specific business ecosystem, this is often the fastest path to delivering useful AI solutions.
Leading enterprise platforms
- Salesforce Agentforce
- ServiceNow AI Agent
- SAP Joule Agents
- Microsoft Dynamics 365 Copilot
- Oracle AI
Key advantages
- Native integration with business applications
- Enterprise-grade security and governance
- Built-in workflows and automation
- Faster implementation
- Vendor support and maintenance
Things to consider
- Higher licensing costs
- Less architectural flexibility
- Potential vendor lock-in
- Features depend on the platform
Ideal use cases
- Customer service
- IT service management
- HR automation
- Finance operations
- Enterprise workflow automation
Summary
Enterprise AI platforms focus on speed, reliability, and business integration. They are an excellent choice when AI should enhance existing enterprise applications rather than replace them.
Building an AI agent from scratch gives you complete control over how it works. Instead of relying on predefined workflows or platform limitations, you decide how the agent reasons, stores information, communicates with other systems, and interacts with users. Although this approach requires more development effort, it provides the flexibility needed for highly specialized solutions.
For organizations with experienced development teams, custom development is often the preferred choice when existing platforms cannot satisfy business or technical requirements.
Popular technologies
- Python
- C# / .NET
- Java
- JavaScript / TypeScript
- OpenAI SDK
- Anthropic SDK
- Google Gen AI SDK
- Model Context Protocol (MCP)
Why choose custom development?
- Complete architectural freedom
- Unlimited customization
- No vendor lock-in
- Freedom to select models and libraries
- Easy integration with existing systems
Things to consider
- Longer development time
- Requires AI and software engineering expertise
- You are responsible for security, scaling, monitoring, and maintenance
Ideal use cases
- Custom business workflows
- Complex enterprise applications
- Specialized integrations
- Products that require unique AI capabilities
Summary
Custom development delivers the greatest flexibility and control, making it ideal for organizations that have the technical expertise to build and maintain their own AI solutions.
Choosing a platform is one of the first and most important decisions when building an AI agent. The right choice affects development speed, maintenance, scalability, security, and long-term flexibility. Fortunately, there are many options available, ranging from writing code from scratch to using enterprise platforms or cloud services. Each approach is designed for different types of projects and teams.
This collection introduces the most common ways to build AI agents and explains when each approach is most suitable. Whether you are creating a small automation or a large enterprise solution, understanding these options will help you make an informed decision.
The main approaches
| Approach | Best suited for |
|---|---|
| Custom development | Maximum flexibility |
| Enterprise platforms | Existing business systems |
| Low-code platforms | Fast automation |
| Cloud AI platforms | Enterprise-scale solutions |
| Open-source frameworks | Advanced customization |
In this collection
- Building AI agents from scratch
- Enterprise AI platforms
- Low-code and no-code tools
- Cloud-based AI services
- Open-source frameworks
- Choosing the right solution
Summary
Every platform offers different strengths. The best choice depends on your business goals, technical expertise, budget, and existing technology stack.
A good logging configuration helps you troubleshoot problems quickly while avoiding unnecessary telemetry and storage costs. In ASP.NET Core, Application Insights is configured in two parts: one for connecting to Azure and another for controlling which log messages are collected.
Configure the Application Insights Connection
The ApplicationInsights section contains the connection to your Azure Application Insights resource.
{
  "ApplicationInsights": {
    "ConnectionString": "InstrumentationKey=...;IngestionEndpoint=..."
  }
}
Using a Connection String is the recommended approach and replaces the older Instrumentation Key.
Configure Logging
The Logging section determines which messages are written by your application. In most cases, the global LogLevel settings are sufficient. If needed, you can also define provider-specific settings for Application Insights.
{
  "ApplicationInsights": {
    "ConnectionString": "InstrumentationKey=...;IngestionEndpoint=..."
  },
  "Logging": {
    "LogLevel": {
      "Default": "Information",
      "YourCompany.YourApplication": "Information",
      "Microsoft": "Warning",
      "System": "Warning",
      "Microsoft.Hosting.Lifetime": "Information"
    },
    "ApplicationInsights": {
      "LogLevel": {
        "Default": "Information",
        "YourCompany.YourApplication": "Information",
        "Microsoft": "Warning",
        "System": "Warning"
      }
    }
  }
}
What Each Setting Does
| Setting | Purpose |
|---|---|
ApplicationInsights:ConnectionString |
Connects the application to your Azure Application Insights resource. |
Logging:LogLevel |
Defines the default log levels used throughout the application. |
Logging:ApplicationInsights:LogLevel |
Optionally overrides the log levels used only by the Application Insights logging provider. |
Recommended Production Configuration
A balanced production configuration is usually:
- Default:
Information - Your application namespace:
Information - Microsoft:
Warning - System:
Warning - Microsoft.Hosting.Lifetime:
Information
For development, you can temporarily change your own application's namespace to Debug or Trace to collect more detailed diagnostic information without increasing the verbosity of framework logs.
This configuration provides useful application telemetry, keeps framework logging under control, and makes troubleshooting easier while avoiding unnecessary noise and storage costs.
Artificial Intelligence is no longer limited to data scientists. Modern cloud platforms provide ready-to-use AI services that allow developers to add intelligent capabilities to applications with minimal machine learning expertise.
Core AI Capabilities
Azure offers a broad portfolio of managed AI services for different use cases:
- Generative AI – Create chatbots, assistants, and content generation solutions using large language models.
- Document Intelligence – Extract structured information from invoices, receipts, forms, and other business documents.
- AI Search – Build intelligent search experiences across structured and unstructured data using semantic and vector search.
- Vision & Speech – Analyze images and videos, recognize text, convert speech to text, generate natural speech, and translate conversations.
- Language AI – Detect sentiment, recognize entities, summarize text, translate languages, and power conversational applications.
- Content Safety – Automatically detect harmful or inappropriate text and images before they reach users.
Building Smarter AI Applications
A common architecture combines AI Search with generative AI. Documents are indexed, relevant information is retrieved, and only the most useful content is supplied to the language model. This retrieval-based approach improves response accuracy while enabling AI applications to work with private organizational data without relying solely on the model's built-in knowledge.
Simplifying AI Development
Modern AI development platforms provide centralized workspaces for managing models, datasets, and shared resources. They also include tools for governance, collaboration, deployment, and monitoring. AI-powered assistants further improve productivity by helping developers generate scripts, troubleshoot cloud resources, analyze costs, and identify security or compliance issues, making it easier to design, deploy, and maintain intelligent applications at scale.
A surprisingly large C:\Windows\System32\Configuration folder can consume tens of gigabytes on a Windows Server. One common cause is the DSC (Desired State Configuration) status history stored in the ConfigurationStatus folder.
In this case, the folder contained more than 30,000 status files and consumed over 40 GB of disk space. Although the Local Configuration Manager (LCM) was configured to retain status information for only a limited number of days, old files were still present, indicating that the cleanup process was no longer working correctly.
A structured approach helps determine whether the problem is caused by excessive status files, corrupted DSC state information, or a failing configuration.
The process consists of three main steps:
- Analyze the current DSC configuration and status history.
- Clean up old status files that are no longer needed.
- Repair DSC and identify any configuration resources that are failing.
Following these steps helps reclaim disk space, restore DSC functionality, and identify configuration issues that may prevent DSC from running successfully.
If cleanup does not resolve the issue, the next step is to investigate DSC itself.
First restart the relevant services:
Restart-Service WinRM -Force
Restart-Service WmiApSrv -Force -ErrorAction SilentlyContinue
Next, review the DSC operational log for detailed error messages:
Get-WinEvent -LogName "Microsoft-Windows-DSC/Operational" -MaxEvents 20 |
    Select-Object TimeCreated, Id, LevelDisplayName, Message |
    Format-List
The operational log often reveals the resource responsible for the failure.
To test the current DSC configuration, manually start a configuration run:
Start-DscConfiguration -UseExisting -Wait -VerboseIn this scenario, DSC reported a failure in the MSFT_AccountPolicy resource while attempting to update the Minimum_Password_Length setting.
This indicates that:
- DSC is still able to load the current configuration.
- The active configuration contains a failing resource.
- The failure may be caused by a conflict with local or domain password policies.
- Corrupted DSC status information may be generated when the configuration repeatedly fails.
At this stage, review the DSC configuration source and verify whether password policy settings should still be managed by DSC. Correcting or removing the failing configuration and then applying a new configuration is typically the final step in restoring a healthy DSC environment.
Once the folder size is known, inspect how DSC is configured and whether it should be removing old status records.
Check the types of files stored in the status folder:
Get-ChildItem "C:\Windows\System32\Configuration\ConfigurationStatus" |
    Group-Object Extension |
    Sort-Object Count -Descending |
    Select-Object Count, Name
This provides insight into what DSC is generating and whether unexpected file types are present.
Review the Local Configuration Manager (LCM) configuration:
Get-DscLocalConfigurationManager | Select-Object *Pay particular attention to:
| Setting | Purpose |
|---|---|
| ConfigurationMode | Defines how DSC applies configurations |
| RefreshMode | Determines how configurations are received |
| StatusRetentionTimeInDays | Controls how long status history is kept |
| RefreshFrequencyMins | Defines how often DSC checks for updates |
Finally, inspect the recorded DSC execution history:
Get-DscConfigurationStatus -AllIf DSC reports deserialization errors, the status history or DSC state information may be corrupted and additional repair steps will be required.
The ConfigurationStatus folder contains historical DSC execution information. When retention stops working correctly, the folder can grow to many gigabytes and contain thousands of old files.
Before deleting anything, stop the WinRM service and create a backup location:
Stop-Service WinRM

New-Item D:\DSCBackup -ItemType Directory
A practical approach is to remove status files older than 30 days:
Get-ChildItem "C:\Windows\System32\Configuration\ConfigurationStatus" |
    Where-Object LastWriteTime -lt (Get-Date).AddDays(-30) |
    Remove-Item -Force
This removes only historical status information and leaves recent records intact.
After the cleanup, verify whether DSC can read the remaining status information:
Get-DscConfigurationStatus | Select-Object StartDate,Type,StatusIf DSC status retrieval works again, the problem was likely caused by old or corrupted status files.
If the same deserialization error continues to appear even after removing the historical data, the issue is likely deeper than the status history itself and may involve corrupted DSC state information or a failing DSC configuration.
Cleaning the folder reduces disk usage, but additional troubleshooting may still be necessary to restore full DSC functionality.
A large ConfigurationStatus folder is often the first sign that DSC status retention is no longer working correctly. Before making any changes, determine how much space is being consumed and whether old status files are accumulating.
First identify the operating system version:
Get-ComputerInfo | Select-Object WindowsProductName, WindowsVersion, OsBuildNumberThis helps determine whether known DSC issues may apply to the server version.
Count the number of status files:
(Get-ChildItem "C:\Windows\System32\Configuration\ConfigurationStatus").CountA very high number may indicate that status files are no longer being cleaned up automatically.
Calculate the total size:
Get-ChildItem "C:\Windows\System32\Configuration\ConfigurationStatus" -File |
    Measure-Object Length -Sum
Review the oldest files:
Get-ChildItem "C:\Windows\System32\Configuration\ConfigurationStatus" |
    Sort-Object LastWriteTime |
    Select-Object -First 10
Review the newest files:
Get-ChildItem "C:\Windows\System32\Configuration\ConfigurationStatus" |
    Sort-Object LastWriteTime -Descending |
    Select-Object -First 10
Comparing old and new files helps determine whether retention is working and whether DSC is still actively generating status data.
Have you ever wondered where all your disk space has gone? Instead of manually browsing folders, Windows includes a powerful command that quickly identifies the largest space consumers on your drive.
The Command
diskusage C:\ /h /t=10What It Does
This command scans the C: drive and displays the 10 largest folders or files, helping you quickly locate areas that consume the most storage.
| Option | Description |
|---|---|
C:\ |
Starts the scan at the root of the C: drive |
/h |
Shows sizes in a human-readable format (MB, GB, TB) |
/t=10 |
Limits the output to the top 10 largest results |
Why It Is Useful
- Quickly identify storage problems
- Find large folders without third-party tools
- Useful for Windows cleanup and troubleshooting
- Easy to run from Command Prompt or PowerShell
Example Output
45.2 GB  C:\Windows
32.8 GB  C:\Users
18.4 GB  C:\Program Files
12.1 GB  C:\ProgramData
In this example, the largest space consumers are displayed first, making it easy to focus cleanup efforts where they will have the biggest impact.
Additional Helpful Variations
Show all results:
diskusage C:\ /hAnalyze a specific folder:
diskusage C:\Windows /h /t=20Limit the folder depth:
diskusage C:\ /h /u=3If a Windows machine is running low on disk space, this command is often one of the fastest ways to discover where the storage is being used.
Thinking about trying a newer version of Visual Studio without changing your current setup? Good news: different major versions of Visual Studio can be installed on the same computer and used independently.
How It Works
Visual Studio 2022 and Visual Studio 2026 are designed to support side-by-side installation. Installing the newer version does not replace or uninstall the older one. Each version maintains its own:
- Installation files
- Settings and preferences
- Workloads and components
- Extensions and add-ins
This makes it easy to test new features while continuing to work on existing projects in a stable environment.
Benefits
- Keep production work on a familiar version
- Explore new tools and features safely
- Compare behavior between versions
- Gradually migrate projects when ready
Things to Consider
- Additional disk space is required because both versions are installed separately.
- Extensions usually need to be installed for each version individually.
- Opening a project in a newer version may introduce changes that are not fully compatible with older versions.
Recommended Approach
Many developers keep the older version for day-to-day work and install the newer version for testing, learning, and evaluating new capabilities. This provides flexibility while reducing the risk of disrupting existing projects.
For most users, running both versions side by side is the safest and most practical way to evaluate a new Visual Studio release.
Email attacks are becoming smarter, faster, and harder to detect. In its latest security report, Microsoft revealed how phishing campaigns evolved during the first quarter of 2026 — and why traditional defenses are no longer enough.
Attackers are moving away from simple spam emails and using more advanced social engineering tactics. One of the biggest changes is the rapid growth of QR code phishing (sometimes called quishing). Instead of clicking suspicious links, users are tricked into scanning QR codes that lead to fake login pages. Microsoft reported that these attacks more than doubled during the quarter.
Another rising tactic is CAPTCHA-gated phishing, where fake verification steps make malicious websites appear trustworthy. These campaigns are designed to bypass automated security tools and create a false sense of legitimacy.
The report also highlighted the continued rise of Business Email Compromise (BEC) attacks. Rather than using malware, attackers impersonate coworkers, managers, or finance teams to request payments, payroll updates, or sensitive information.
Key lessons from the report:
- Email threats are becoming more personalized
- QR codes are increasingly used to bypass filters
- Multi-factor authentication alone may not stop modern phishing
- Passwordless sign-ins and phishing-resistant authentication are becoming essential
The main takeaway: cybersecurity today is not only about blocking malware — it’s about protecting identities and recognizing manipulation before damage is done.
Original article: Microsoft Security Blog
Running code on a supercomputer sounds simple — until you see what happens behind the scenes. Modern high-performance machines are not just “big computers.” They are massive systems built from thousands of connected processors, advanced cooling systems, and highly optimized software.
The article explores the hidden complexity of running applications on a European supercomputer worth hundreds of millions of euros. Unlike a normal laptop or cloud server, these machines require developers to think differently about performance, memory usage, and communication between computing nodes.
Key challenges include:
- Parallel computing: Tasks must be split into thousands of smaller jobs running at the same time.
- Efficient communication: Processors constantly exchange data, and slow communication can reduce performance dramatically.
- Resource management: Jobs are scheduled carefully because computing time is expensive and limited.
- Optimization: Even small inefficiencies can waste huge amounts of power and processing capacity.
One interesting takeaway is that writing code for supercomputers is often more about engineering and planning than raw programming skill. Developers must understand hardware architecture, networking, and scalability to fully use the machine’s power.
The article also highlights how these systems support scientific research, AI training, climate modeling, and complex simulations that would be impossible on consumer hardware.
Original article: What It Actually Takes to Run Code on a €200M Supercomputer
Artificial intelligence is changing how companies work — but what happens when employees themselves become part of the training data? A recent internal move at Meta has sparked debate about privacy, workplace culture, and the future of AI-powered organizations.
According to reports, Meta introduced software that monitors employee activity on company devices. The system can reportedly track actions such as mouse movements, clicks, typing behavior, and screenshots within approved work applications. The goal appears to be improving AI systems by studying how people interact with digital tools in real work environments.
This decision highlights a growing shift in the tech industry:
- AI is becoming deeply integrated into daily work
- Companies are searching for more real-world data to improve AI performance
- Employee concerns about privacy and transparency are increasing
Critics argue that constant monitoring may damage trust between companies and workers. Others believe these systems could eventually improve productivity and help businesses automate repetitive tasks more effectively.
The situation also raises larger questions:
| Topic | Why It Matters |
|---|---|
| Workplace Privacy | Employees may worry about excessive monitoring |
| AI Training Data | Human behavior is becoming valuable input for AI |
| Company Culture | Trust and morale can be affected by surveillance tools |
As AI adoption accelerates, businesses will likely face growing pressure to balance innovation with employee rights and transparency.
Original article: TheStreet article
Have you noticed more people wearing tiny cameras while walking, shopping, or even cleaning their homes? What once looked unusual is quickly becoming part of everyday life. Personal body cameras are no longer only for police officers or extreme sports creators — regular people are now using them during normal daily activities.
The trend is growing for several reasons. Some people use wearable cameras to create social media content without holding a phone all day. Others see them as a safety tool that can document accidents, public conflicts, or suspicious situations. In busy cities, many users say the cameras give them a sense of protection and accountability.
Modern devices are also much smaller and easier to use than before. Many can record hands-free for hours, connect directly to apps, and instantly upload videos online. This convenience has helped wearable recording become more common in public spaces.
However, the trend also raises important questions:
- Privacy concerns for people being recorded unknowingly
- Social changes as public interactions become more documented
- Ethical debates around constant recording in everyday life
Supporters believe body cameras improve transparency and personal security, while critics worry society may become too comfortable with nonstop surveillance.
As wearable technology becomes cheaper and smarter, recording daily life may soon feel as normal as carrying a smartphone.
Original article: Los Angeles Times article
- .NET
- Agile
- AI
- ASP.NET Core
- Azure
- C#
- Cloud Computing
- CSS
- EF Core
- HTML
- JavaScript
- Microsoft Entra
- PowerShell
- Quotes
- React
- Security
- Software Development
- SQL
- Technology
- Testing
- Visual Studio
- Windows